Calculate the Total Potential Market for a Product or Service
Many data analytic projects need results expressed or weighted in terms of some population. Clients are rarely satisfied with estimates that aren't generalizable, that are confined to just one particular sample or data source. To meet this need, Central Moment has developed an exclusive demographic database. Our database is the most extensive of its kind and draws from proprietary data sources and national statistics offices from around the world.

Students in tertiary education vs population

Population
Employment
Enterprises
Students
Demographics Cubes:
Samples of global market sizing

Opportunity Sizing ->
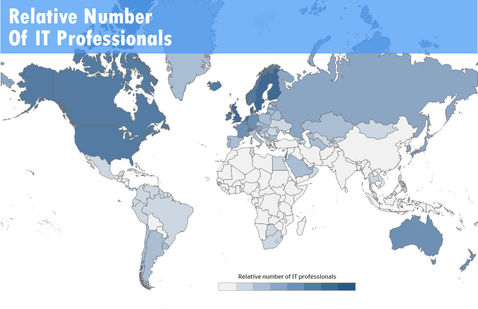
Our demographic database includes estimates of people, students, employees, companies, and business establishments available at a surprising level of detail. At a broad level and including emerging markets, our workplace employment database includes estimates (and forecasts) for 100% of the world's employment and how it is distributed across 90+ occupations, 60+ industries, 9 size categories, and 100+ political entities. We can identify fast-growing employment niches amid the world's economy. In addition, we collect and maintain even greater demographic detail for more developed countries.


Evolution of world employment in technology industries
Forecasts ->
Forecast estimates provide valuable insights with dimensional views at great detail. Furthermore, we also provide forecasts that help bolster the estimates and project across the categories.


WW employment and enterprise by size of enterprise
Integration ->

Integration of market sizing data with a primary market research study helps create a very valuable data set that allows to customize and project the sizing effort defined by the client.

Higher education students, percent of population
Expertise->
Taming Noisy Data Through Bayesian Analysis - A Market Share Tracking Example


